Select Page
Home > Products > Dashboards

Dashboards

Manage entire networks of different types of platforms and access ocean, weather and environment data in one place with our tailor-made dashboards.

Visualize your data

Whether you need to download large quantities of data, monitor vital platform parameters,  access ocean and weather data or simply visualize positions on a map, you can choose from a variety of dashboards that suit your needs.

Don’t hesitate to contact our experts for advice in choosing the best dashboard for you.

ArgosWeb

Argos users can access their data free of charge via the internet, by logging on to a secure, attractive and user-friendly website.

With ArgosWeb, you can view platform trajectories on land & marine maps. Its responsive design means you can use it out in the field on your smartphone or tablet.

Some features:

  • View positions on a map
  • Export on Google Earth
  • Visualize and download data
  • Benefit from additional tools such as the satellite pass prediction tool and transmission prediction tool
CLS SeeChart dashboards

SeeChart

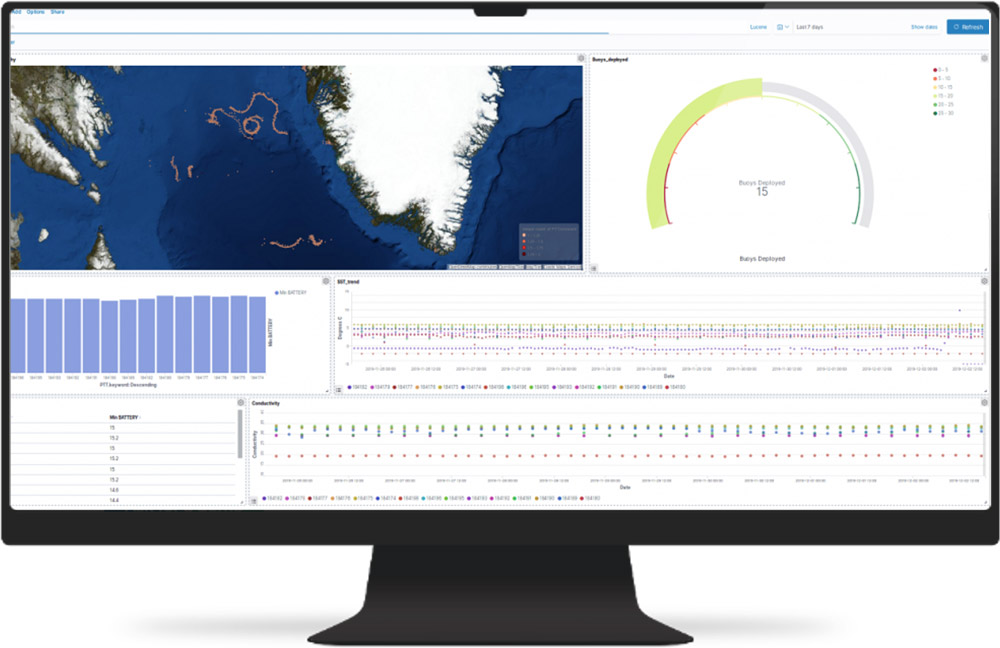
Seechart is a unique dashboard for monitoring oceanographic equipment that allows you to manage, on a single visualization tool, your entire network of different types of oceanographic observing platforms (buoys, floats,…).

Some features:

  • Visualize the position, metadata and sensor data of an unlimited number of oceanographic platforms
  • Monitor vital parameters (i.e battery status, etc)
  • View & download in-situ tracks with satellite ocean data
  • Perform immediate comparison with satellite data
  • And much more… this dashboard is fully customizable according to your needs!
CLS SeeWater dashboards

SeeWater

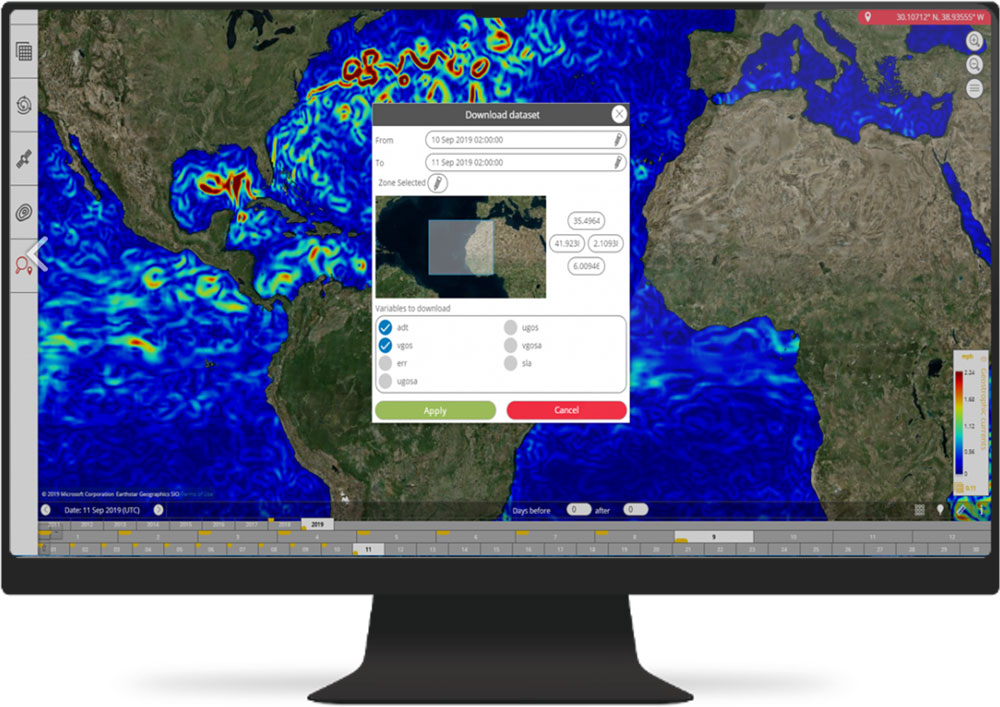
SeeWater is a state-of-the-art web portal to display and download daily, fine-scale information about the physical ocean – capitalizing on CLS oceanographic expertise.

It provides a single-entry point for ocean and weather data accessible via open data websites (Copernicus Marine Service, Climate Change Service, etc) and provides an intuitive, easy-to-use interface for displaying in-situ data with satellite observations of the physical ocean.

Some features:

  • Display & download a large catalogue of data
  • Create & download your own graphs or datasets
  • Vizualize meteorological, oceanographic and contintental water data
  • Simple and intuitive time coverage selection
CLS View dashboards

CLS View

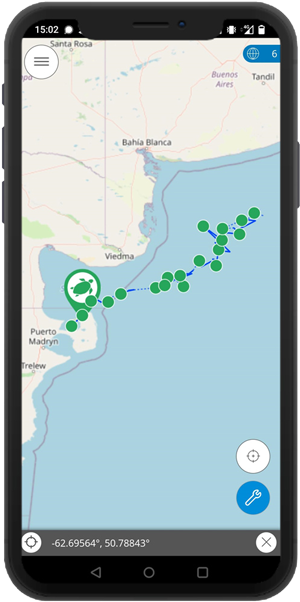
CLS View is an Android application to display any mobile tracking data provided by CLS.

Its user-friendly interface for both land and sea applications means you can display sea positions on detailed maps (OpenStreetMap, Marine & Satellite). CLS View also offers the possibility to upload past positions in the memory of your smartphone or tablet.

Some features:

  • Displaying positions (Date, Latitude/Longitude, heading and speed)
  • A measuring tool to calculate the distance between several points
  • A tool to create zones
  • An Estimated Time of Arrival (ETA) calculator
get it on google play
app store downloading
Argosweb portal

API Services

CLS has developed a machine to machine/automatic interface called WebServices that distributes Argos data.

This servce is free of charge and makes it possible for you to contact CLS’s database directly via internet and receive your data in various formats as well as useful information such as error estimates, diagnostic data, sensor data etc.

Begin with Argos

CLS teams experts in environmental monitoring from space are at your disposal to connect any of your projects.