← Back
Flatback turtles tracked to identify foraging areas and their variability within the species

Flatback turtles are marine turtles endemic to the Australian continental shelf. Few information is available on them, which hinder conservation measures. Satellite tracking and stable isotope analysis of females nesting in eastern Queensland, Australia, were used to identify foraging areas and their variability within the species.
Flatback turtles (Natator depressus) are endemic to the Australian continental shelf, only breed on the Australian coast, and do not have an oceanic life stage, living their whole lives in coastal habitats. Few data are currently available to assess their vulnerability to various threats, foraging grounds, and even basic information such as diet is lacking. In these conditions, identifying the threats to the species, and thus defining relevant conservation strategies, is nearly impossible.
Tracking by satellite is a way of improving such knowledge, providing high quality information, but on a more or less limited number of individuals. Stable isotope analysis (SIA), particularly of carbon (δ13C) and nitrogen (δ15N), can be used to study animal movements since different diets and/or habitats can have different δ13C and/or δ15N, and animal δ13C/δ15N reflect their time-integrated diet and habitat use. If foraging grounds located by tracking have a distinctive isotopic signature, satellite-tracking can be complemented by stable isotope analysis.
More info about animal tracking with Argos
Tracking and sampling flatback turtles
44 female flatback turtles from 8 nesting beaches in eastern Queensland, Australia, were tagged using Argos-linked Fastloc GPS tags between 2009 and 2016. Stable isotope samples were obtained from 18 female turtles nesting at Wunjunga and 15 at Curtis by collecting a 0.5 cm2 epidermis sample. Among those, 16 turtles were both tracked and sampled.
Tracked individuals migrated up to ~1300 km, staying mostly within ~40 km from the coast. They reached their foraging grounds, dispersed from Shoalwater Bay in the south (22.1° S) to Torres Strait in the north, i.e. along a ~1500 km shoreline.
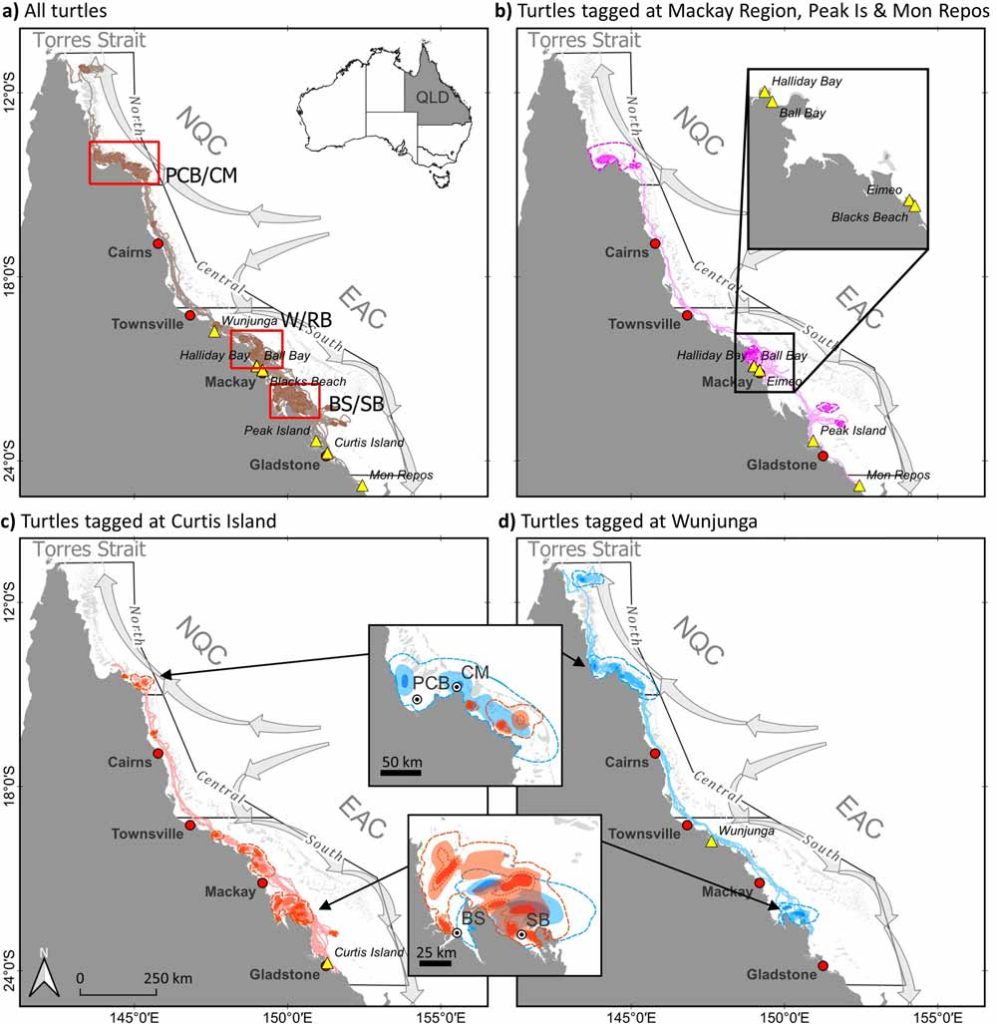
The three main foraging regions thus identified were widely dispersed. 45% of the tracked turtles used the Broad Sound/Shoalwater Bay region, 21% the area between the Princess Charlotte Bay and Cape Melville region, and 19% the Whitsundays/Repulse Bay region. The 16 individuals which had also been sampled followed the same pattern.
δ13C and δ15N values were compared between individuals sampled at the two sites. Stable isotope analyses were in agreement with the regions found from tracking. The variability in both isotopes in turtles from the same nesting beach shows that they could use different foraging grounds. And similar stable isotope composition in turtles nesting at different sites that they can also use the same foraging area.
Analysis and modelling confirmed that δ15N was showing distinctive differences along the shoreline, and thus be considered as a predictor of the foraging region of flatback turtles, while δ13C did not show many differences between the foraging sites.
This could be used to determine the proportion of nesting individuals using the different foraging regions by sampling a large number nesting flatback turtles. The combined use of tracking and stable isotope analysis was useful to ascertain flatback turtle movement and habitat use patterns, and thus to assess the relative importance of the different foraging areas for flatback turtles.
Knowing such patterns can have potential management and conservation applications. This study could also be replicated with other migratory species along the eastern Australian coast (e.g. bull sharks, spotted mackerel).
Reference & links
- Abrantes K, Wildermann N, Miller IB, Hamann M and others (2024) Intraspecific variability in flatback turtle habitat use: δ15N as an indicator of foraging locations. Endang Species Res 53:167-180. https://doi.org/10.3354/esr01293
- https://www.facebook.com/biopixeloceansfoundation/posts/pfbid0cDDg8rHGwLdRWoxXrCPS4wXk3srm9bPoUmQsvH7DPk8hnAAHgVfwpFoU5oRgXw9ql
- Biopixel Oceans Foundation satellite tagged animals https://biotracker.biopixeloceans.org & research projects https://biopixeloceans.org/research/